Warehouse Operations & Supply Chain Logistics
Executive Summary
- Company: Mid-size clothing rental retailer
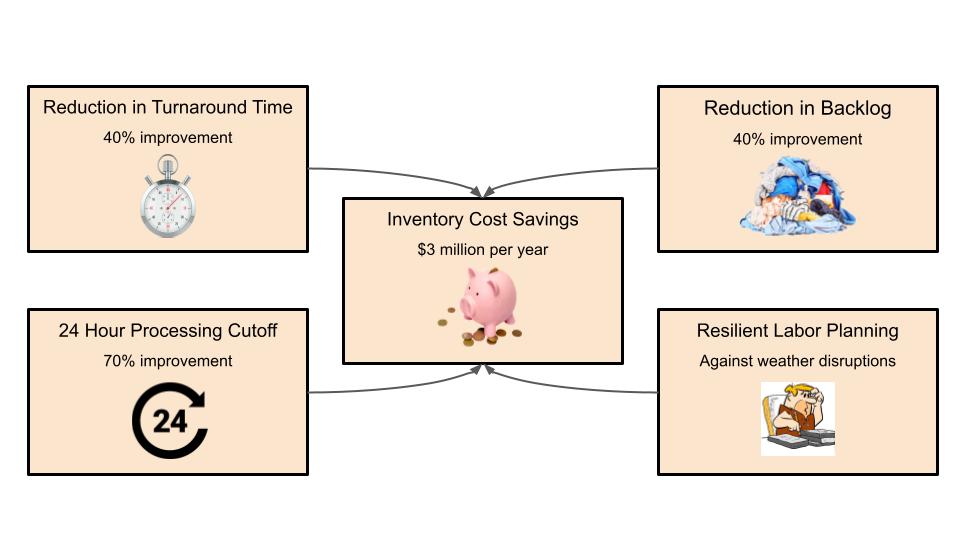
- Results and Impact: $3 million per year in inventory cost savings, from operational improvements in only one warehouse, as a result of:
- 40% reduction in warehouse turnaround time
- 70% increase in units processed within 24 hours
- 40% reduction in normalized backlog
- CapEx: $0
- Problem: Inventory availability and supply for customers as a result of backlogged inbound operations
- Warehouse backlog means clothing is not available for orders, and therefore inventory must be purchased to increase supply
- Solution: Staffing Optimization System that coordinates headcounts across warehouse departments
- This tool prescribes the precise number of people to staff in each warehouse department at each time (there are thousands of staffing decisions prescribed)
- This is customized using over a dozen inputs, entered by operations stakeholders, and leverages inbound volume forecast data
Core operational improvement: Massive reduction in normalized backlog, discussed in detail here.
Context
Inbound Operations and Inventory Availability
Every e-commerce business has outbound operations, whereby the retailer must deliver its products to its customers. Beyond a typical pick, pack, and ship process, a retailer in the clothing rental business must also ensure its products are returned and processed for future rentals.
Upon receipt, a garment goes through whole host of tasks so that garment can be rented by another customer. These tasks, such as cleaning and ironing, are referred to as inbound operations. Efficiently processing these returns increases inventory availability for the retailer’s customers, providing them with greater supply and selection.
Therefore, reducing the inbound turnaround time2 per unit would result in inventory cost savings for the retailer. Rather than increasing inventory supply to meet customer demand, which is quite costly, the retailer effectively receives inventory for free via operational efficiency.

Each inbound task is handled by its own warehouse department. As tasks are completed by warehouse staff, turnaround time is a direct function of department staffing. Specifically, headcounts throughout the warehouse determine overall warehouse productivity.
Consequently, to improve turnaround time the retailer must answer the following overarching question:
How many people should be staffed at each warehouse department at each time?
Warehouse Staffing is Interdependent
For example, how many people should be ironing at 9am on a Monday? What about at 10am? Or in the dry cleaning department? Labor planning across all departments and all operating times becomes highly complex quite quickly. Planning over even a weekly time-horizon involves thousands of staffing decisions. Planning over several weeks or a month scales that complexity.
Staffing decisions are further complicated by their interdependence. Specifically, departments cannot be staffed in isolation because one department’s outflow is another department’s inflow. Departments impact one another because each department provides work for another3, as seen below.
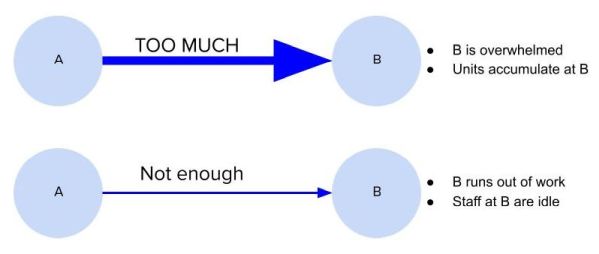
This interdependence is ignored when departments operate independently, in service of their own individual metrics. Global metrics address these pitfalls, by providing a system-wide view of operational success. Specifically, optimizing the following global metrics drives inventory cost savings for the retailer:
- Turnaround Time: The time elapsed from when a garment arrives at a warehouse to when that garment is fully processed, ready to rent.
- Normalized Backlog: The total number of units ready and waiting across all inbound departments, at day’s end, divided by the number of returned units that newly arrived over the course of the entire day
- (Total Inbound Backlog) / (Total Inbound Returns Volume)
Reducing turnaround time means units are available to customers more quickly. Similarly, reducing normalized backlog means the operation as a whole has greater throughput, since units are available to be rented as opposed to in backlog at a department.
Solution - Network Flow Optimization
To adequately model real-world inbound operations, the following dynamics, and more4, must be taken into account:
- Volumes of flow that travel between departments at every time within a time-horizon.
- Travel time between departments, since units do not move instantaneously. Typically, the travel times vary for every pair of departments.
- Work availability: A department can only output work if there are units available for processing
- Maximum headcount: There are physical limits on the number of people who can work in each department simultaneously, by number of workstations.
- Limits on headcount variation within a day or week, otherwise it is impractical to staff according to ideal headcounts.
In addition to the thousands of interdependent decisions the retailer must make, the retailer must also respect the above dynamics and constraints. This is enormously complex.
The rental retailer’s labor planning and throughput problems were addressed using custom extended network flow optimization models5.
Model outputs prescribe headcounts for each department and time throughout the desired time horizon. For example, staff 10 people at department A from 9am - 12pm on Tuesday. The operations team then decides how to staff according to the optimal headcount.
The speed coupled with the large number of customizable stakeholder inputs empowers what-if scenario analysis. Now stakeholders can modify inputs to evaluate the impact on global metrics such as system throughput. Example scenario analyses are below, which can now be investigated in minutes:
- How would the operation perform given increased returns volume?
- What cross-training yields the greatest improvement in throughput?
Results and Impact
Optimization-equipped labor planning generates $3 million per year in inventory cost savings, using conservative estimates. The project was implemented in one warehouse, meaning the impact discussed in this section would have even greater scale if implemented in a larger operation across multiple warehouses.
The impact on global metrics was realized immediately.
Immediate, Sustained Reductions in Normalized Backlog
At any given time, returned units are either in backlog or fully processed. Therefore, a reduction in backlog translates to an increase in inventory supply and availability.
For a quick refresher, normalized backlog shows operational efficiency in terms of total backlog in response to the inbound volume the operation was up against:
Normalized Backlog = (Total Inbound Backlog) / (Total Inbound Returns Volume)
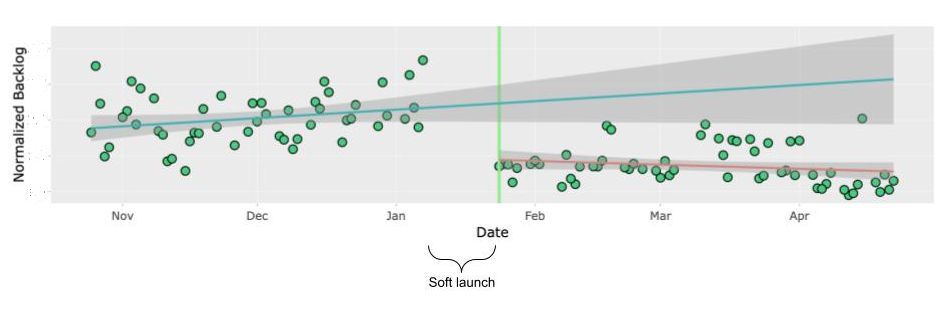
Normalized backlog controls for high and low inbound volume days. The visualization below shows daily normalized backlog both before and after optimization-equipped labor planning was implemented.
- The turquoise and salmon-colored lines are the average normalized backlogs corresponding to the periods before and after the project launched, respectively, projected through the evaluation time-horizon.
- The shaded regions around the turquoise and salmon-colored lines are 95% confidence intervals around the mean7 normalized backlog.
This visualization showcases that the results pertaining to normalized backlog are:
- Immediate
- Stable
- Statistically Meaningful
- Consistent and Reliable
Immediate, Sustained Reductions in Turnaround Time
Reductions in normalized backlog imply reductions in turnaround time. Intuitively, since returns volume arrives every day less backlog means units are processed faster than before. The improvements in turnaround time metrics are below:8
- 40% reduction in average warehouse turnaround time
- 70% increase in units processed within 24 hours.
Fast and Resilient Staffing
Beyond multi-million dollar savings, optimization-based staffing means that the labor planning process is:
- Extremely fast: In contrast to a manual or excel-based process, which can take hours, the algorithmic approach creates labor plans in just a few minutes. Specialized algorithms were developed to ensure the models run quickly.
- Resilient: The speed of the algorithmic approach means that it is easy to rerun the models and generate a new labor plan. This is particularly helpful in response to unexpected events and disruptions, from weather or equipment outages, which would otherwise delay and complicate labor planning.
More Free Cash Flow: No Capital Expenditure
The inventory cost savings and operational improvements throughput optimization has delivered did NOT require:
- Any capital expenditure; zero CapEx. No machines nor equipment were purchased as part of this initiative, nor need to be purchased in the future to realize the impact described above.
- The Throughput Optimization initiative optimizes and reallocates existing resources.
- Any software purchases or licenses. This project was built using open-source software. Consequently, third party software license costs = $0.
- Any change in overall headcount in the Inbound Operation, since optimal headcounts could be achieved by assigning warehouse staff to various departments as needed. E.g., someone could work in department A for half the day, and department B the second half of the day.
The Throughput Optimization initiative generates inventory cost-savings without incurring any cost itself, neither from labor nor capital expenditure. In other words, this project has increased free cash flow by optimizing the company’s existing resources.
Footnotes
Note that data points during the soft launch period were omitted because the new staffing approach was rolled out to each department gradually. Consequently, it would not make sense to evaluate a mixed approach that involved team-wide communication and training.↩︎
Turnaround Time: The time elapsed from when a garment arrives at a warehouse to when that garment is fully processed, ready to rent.↩︎
This is true except for the last step in the inbound process.↩︎
This is a small subset of factors for demonstrative purposes only.↩︎
Note that data points during the soft launch period were omitted because the new staffing approach was rolled out to each department gradually. Consequently, it would not make sense to evaluate a mixed approach that involved team-wide communication and training.↩︎
Confidence intervals around a mean are not expected to include all data points.↩︎
Exact turnaround times omitted for confidentiality reasons.↩︎